You can check the radioactivity concentration in the world in the year 2000.
Please select the material you want to check.
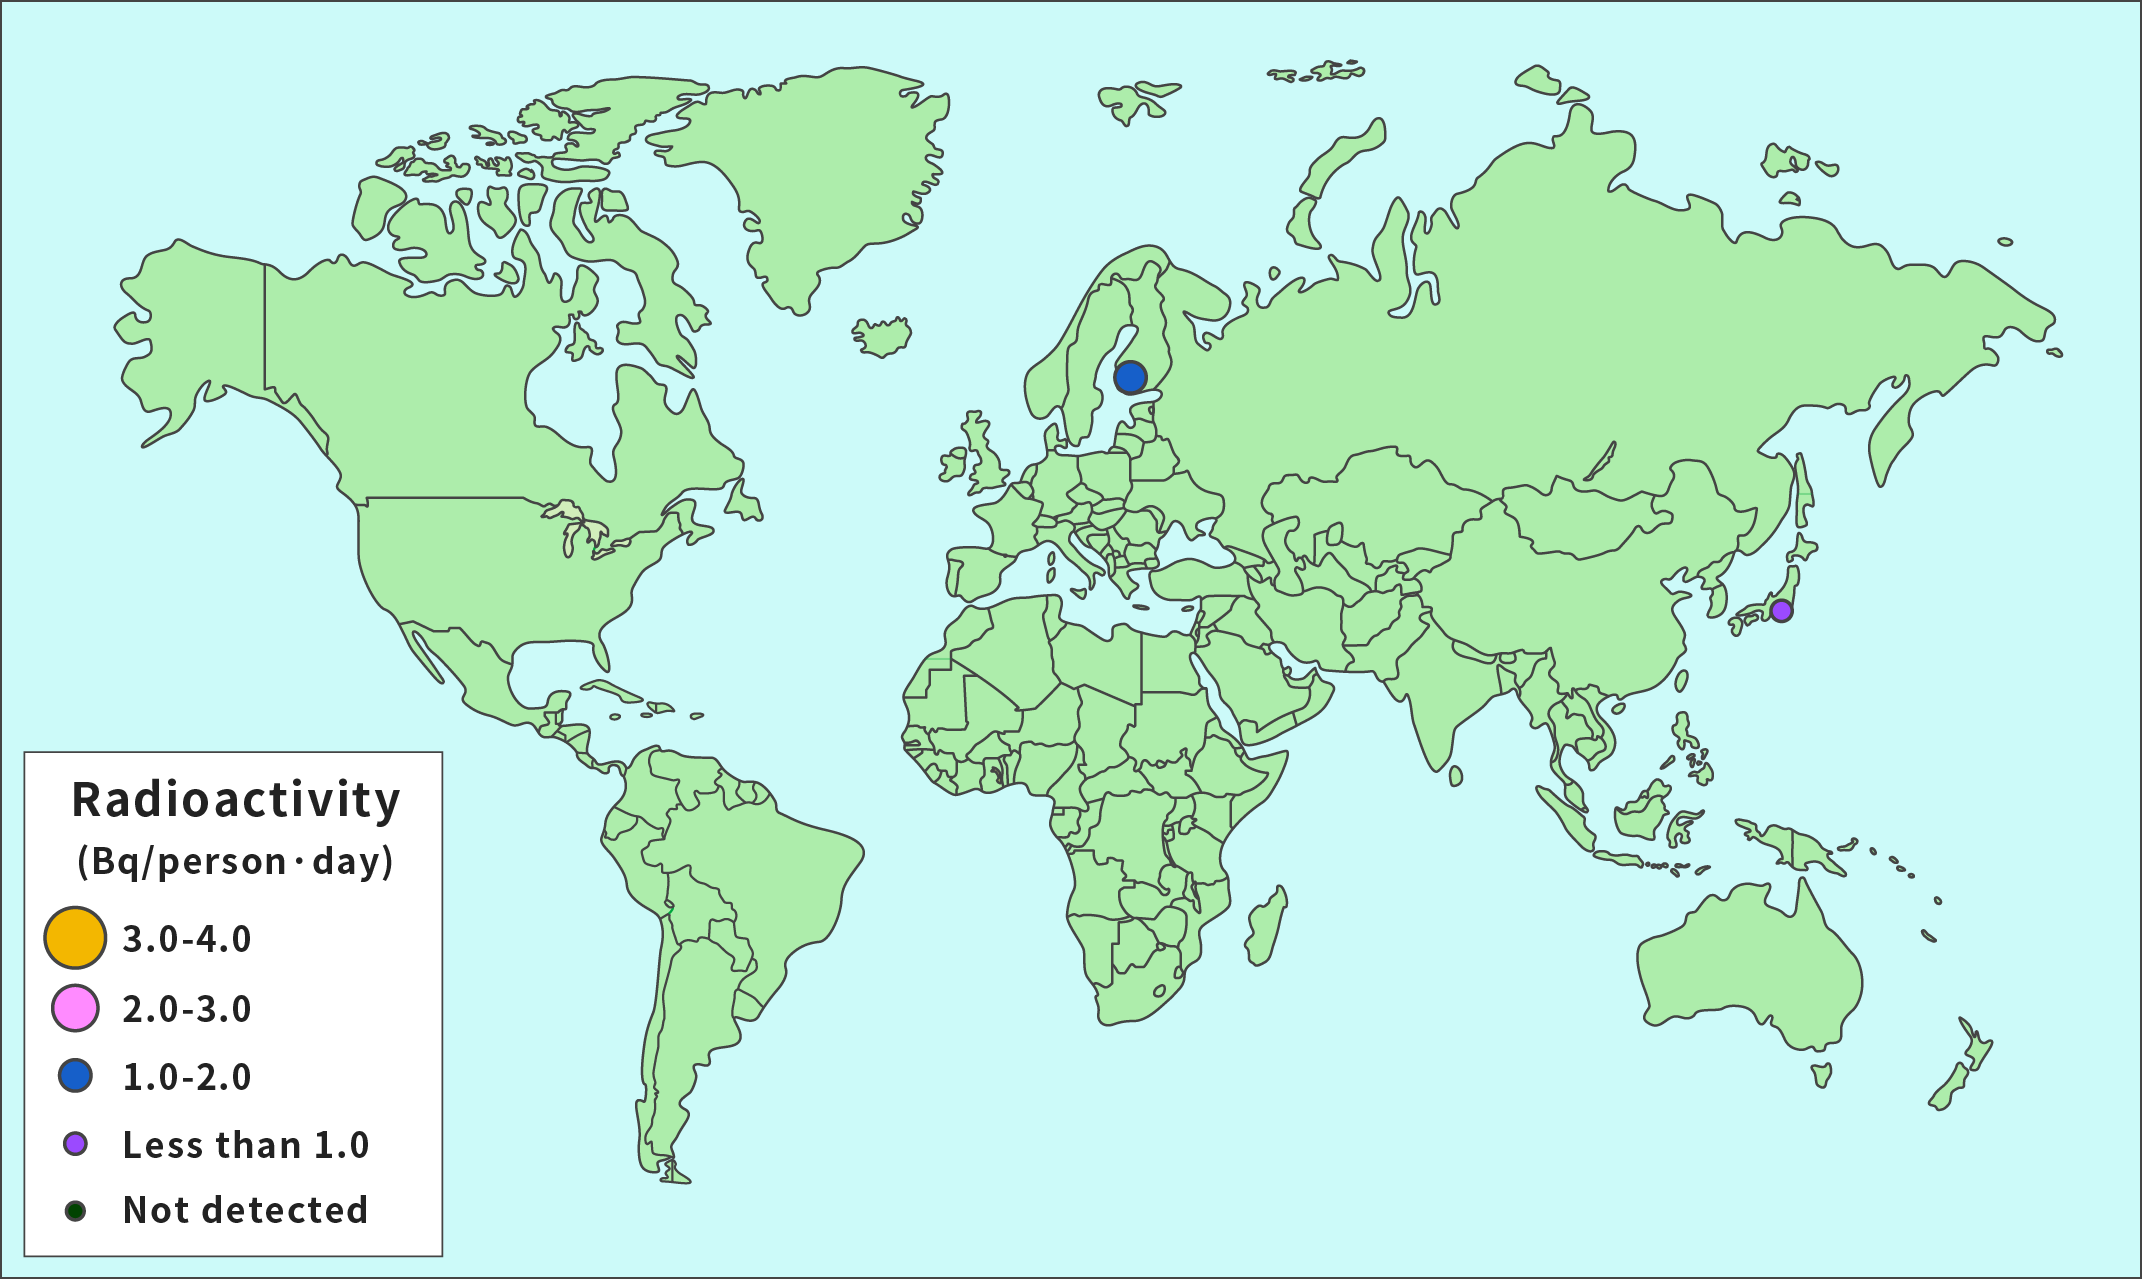
Results of Surveys on Daily Food at Various Places in the World (2000)
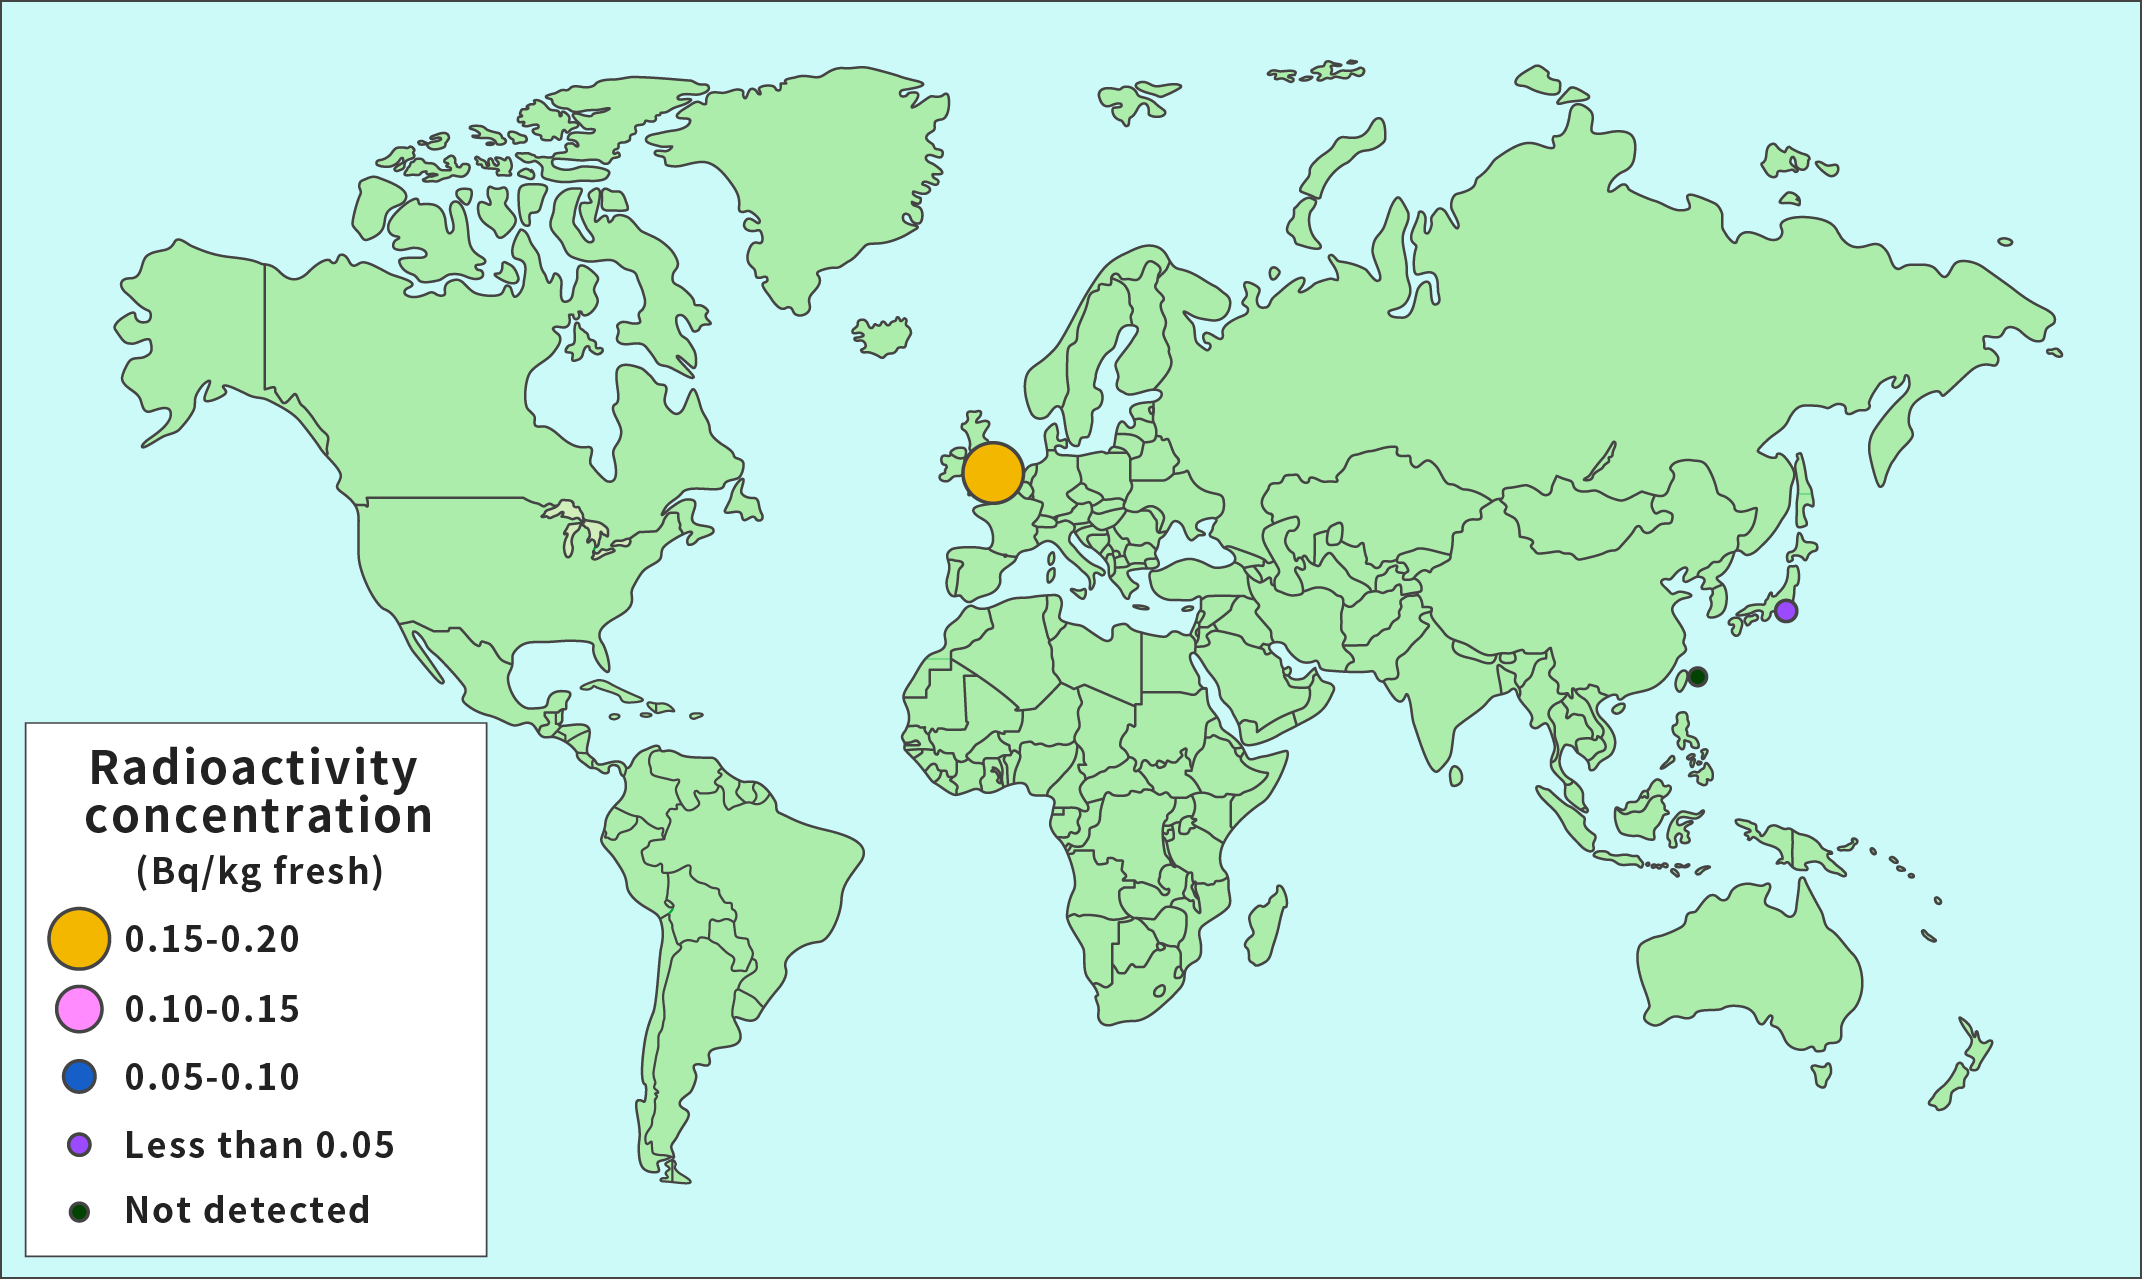
These maps show the year 2000 average of the amount of Sr-90 and Cs-137 contained in daily food (food per person per day) at various places in the world.
Data is shown as circles only for the countries and regions for which survey results are available for this survey sample.
Sr-90

Cs-137
Results of Surveys on Milk at Various Places in the World (2000)
These maps show the amount of Sr-90 and Cs-137 contained in 1 liter of milk at various places in the world in the year 2000.
Data is shown as circles only for the countries and regions for which survey results are available for this survey sample.
Sr-90
Cs-137
Results of Surveys on Vegetables (Root Vegetables) at Various Places in the World (2000)
These maps show the amount of Sr-90 and Cs-137 contained in 1 kg of vegetable (root vegetable) at various places in the world in the year 2000.
Data is shown as circles only for the countries and regions for which survey results are available for this survey sample.
Sr-90

Cs-137
Results of Surveys on Vegetables (Leaf Vegetables) at Various Places in the World (2000)
These maps show the amount of Sr-90 and Cs-137 contained in 1 kg of vegetable (leaf vegetable) at various places in the world in the year 2000.
Data is shown as circles only for the countries and regions for which survey results are available for this survey sample.
Sr-90

Cs-137

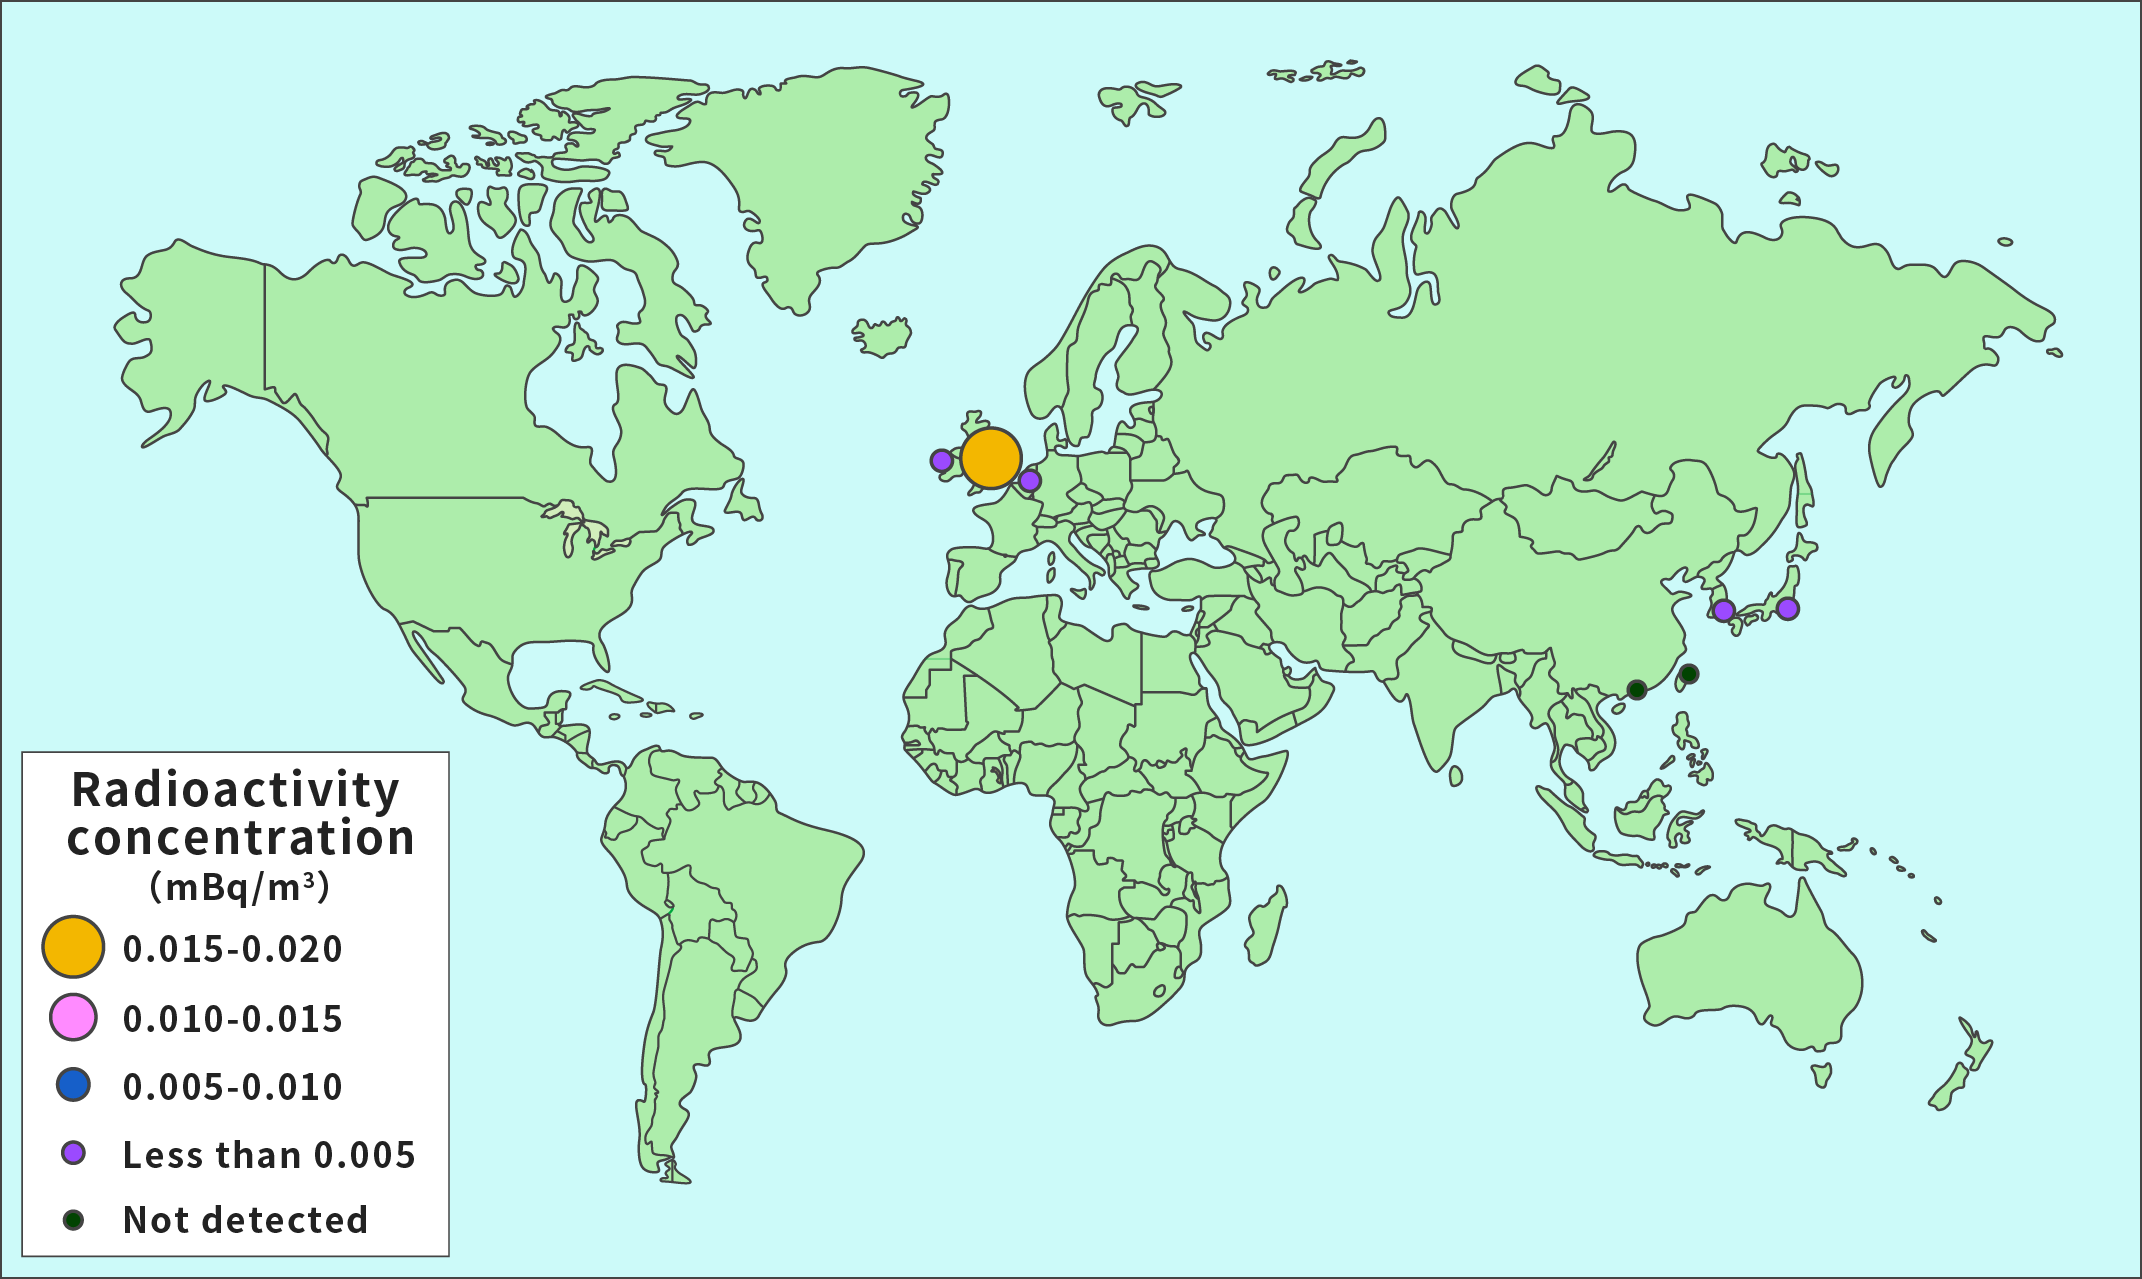
Results of Surveys on Airborne Dust at Various Places in the World (2000)
These maps show the amount of Sr-90 and Cs-137 contained in 1 m3 of the air at various places in the world in the year 2000. We can see that radioactivity is not detected in many places.
Data is shown as circles only for the countries and regions for which survey results are available for this survey sample.
Sr-90

Cs-137
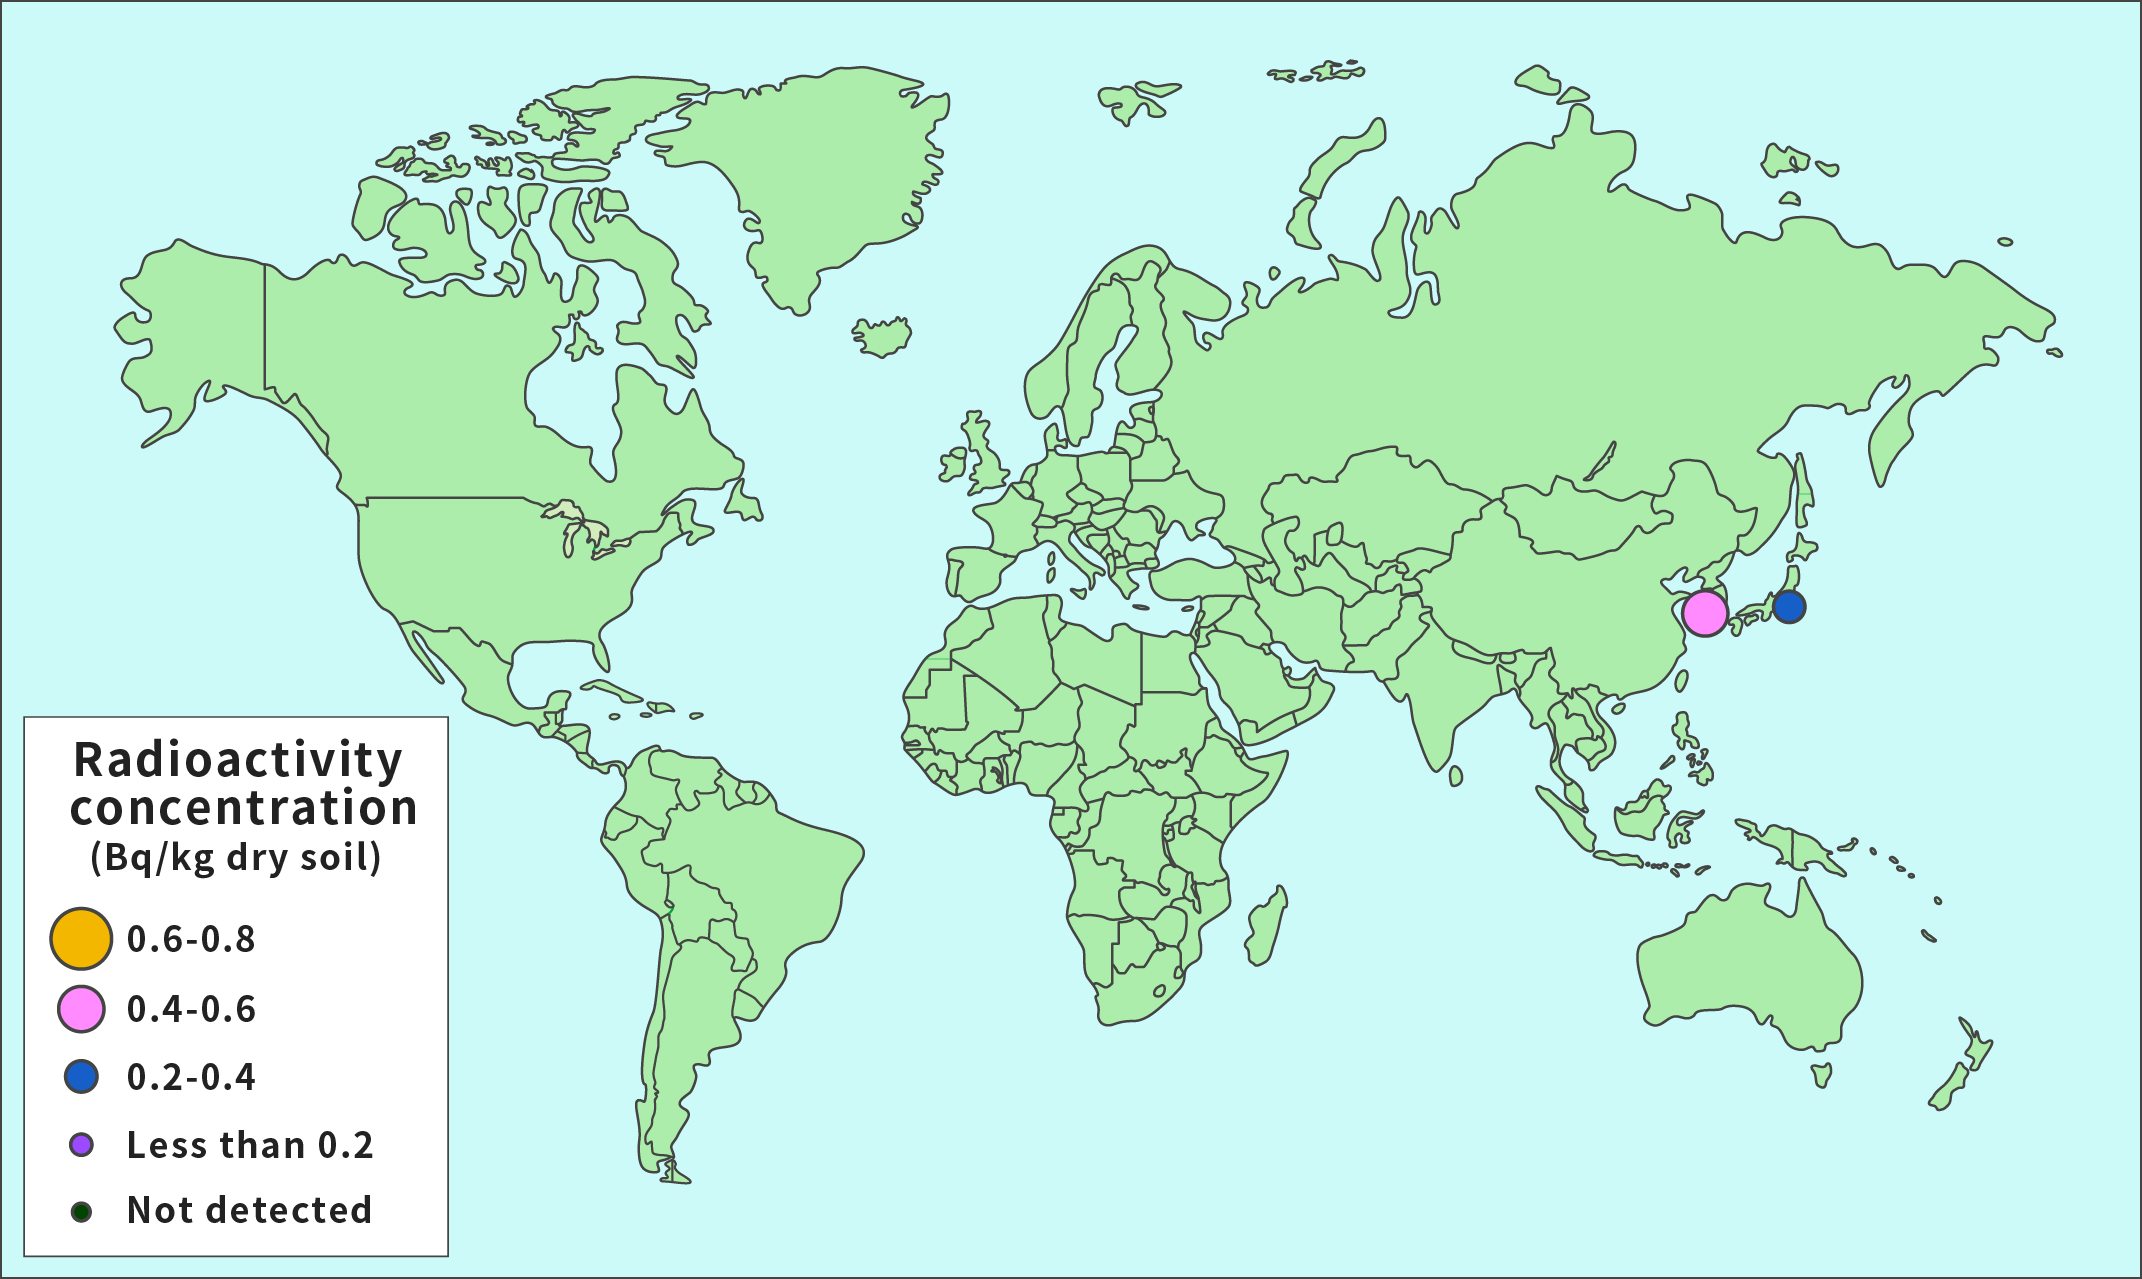
Results of Surveys on Sea Sediment at Various Places in the World (2000)
These maps show the amount of Sr-90 and Cs-137 contained in 1 kg of sea sediment at various places in the world in the year 2000.
Data is shown as circles only for the countries and regions for which survey results are available for this survey sample.
Sr-90
Cs-137

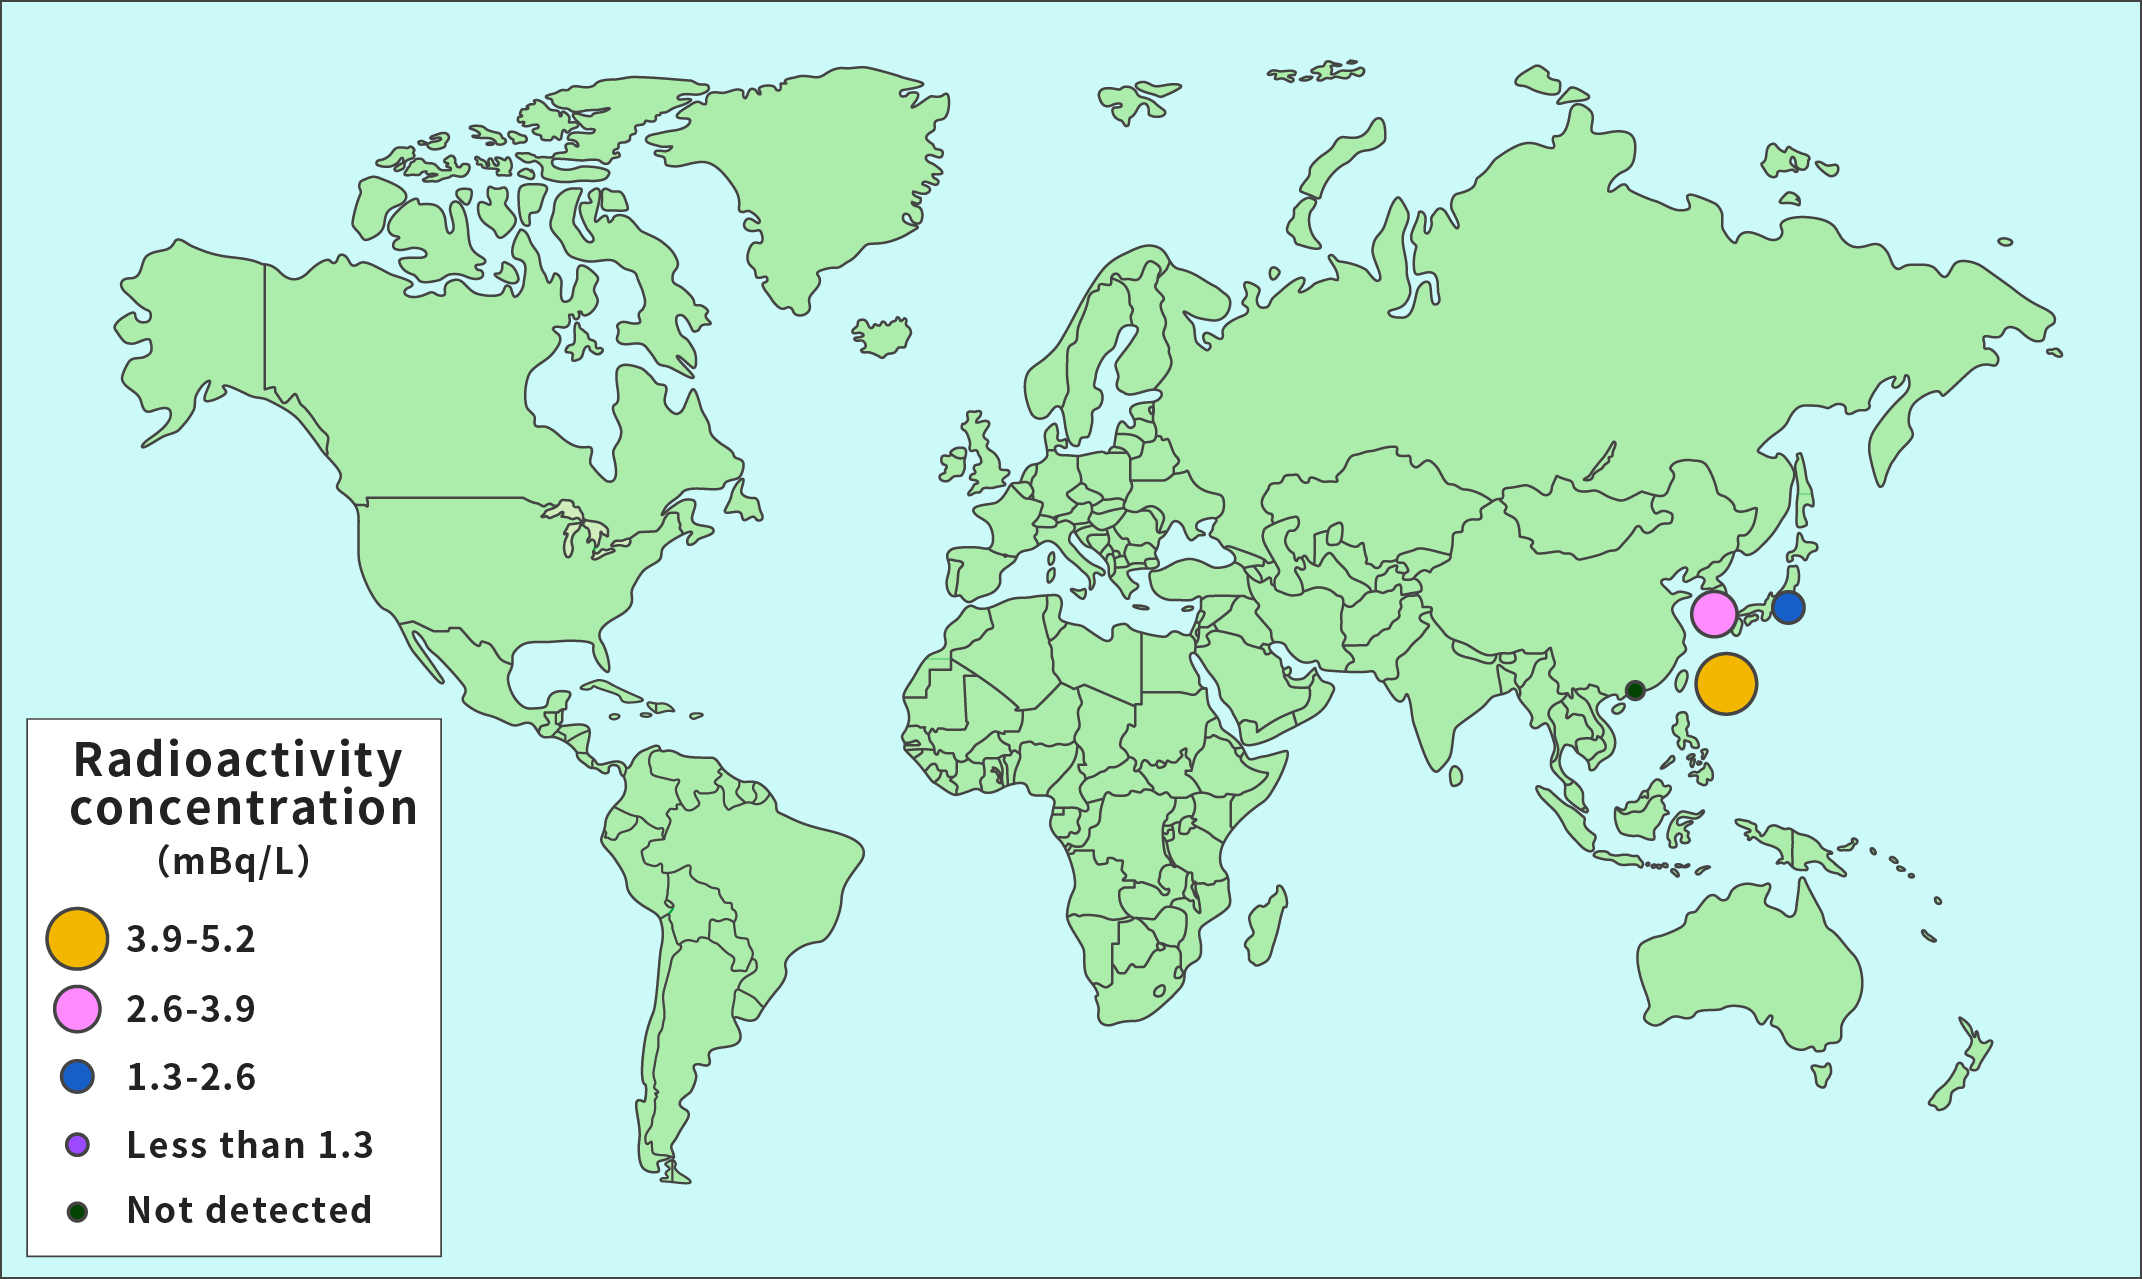
Results of Surveys on Sea Water at Various Places in the World (2000)
These maps show the amount of Sr-90 and Cs-137 contained in 1 liter of sea water at various places in the world in the year 2000.
Data is shown as circles only for the countries and regions for which survey results are available for this survey sample.
Sr-90

Cs-137
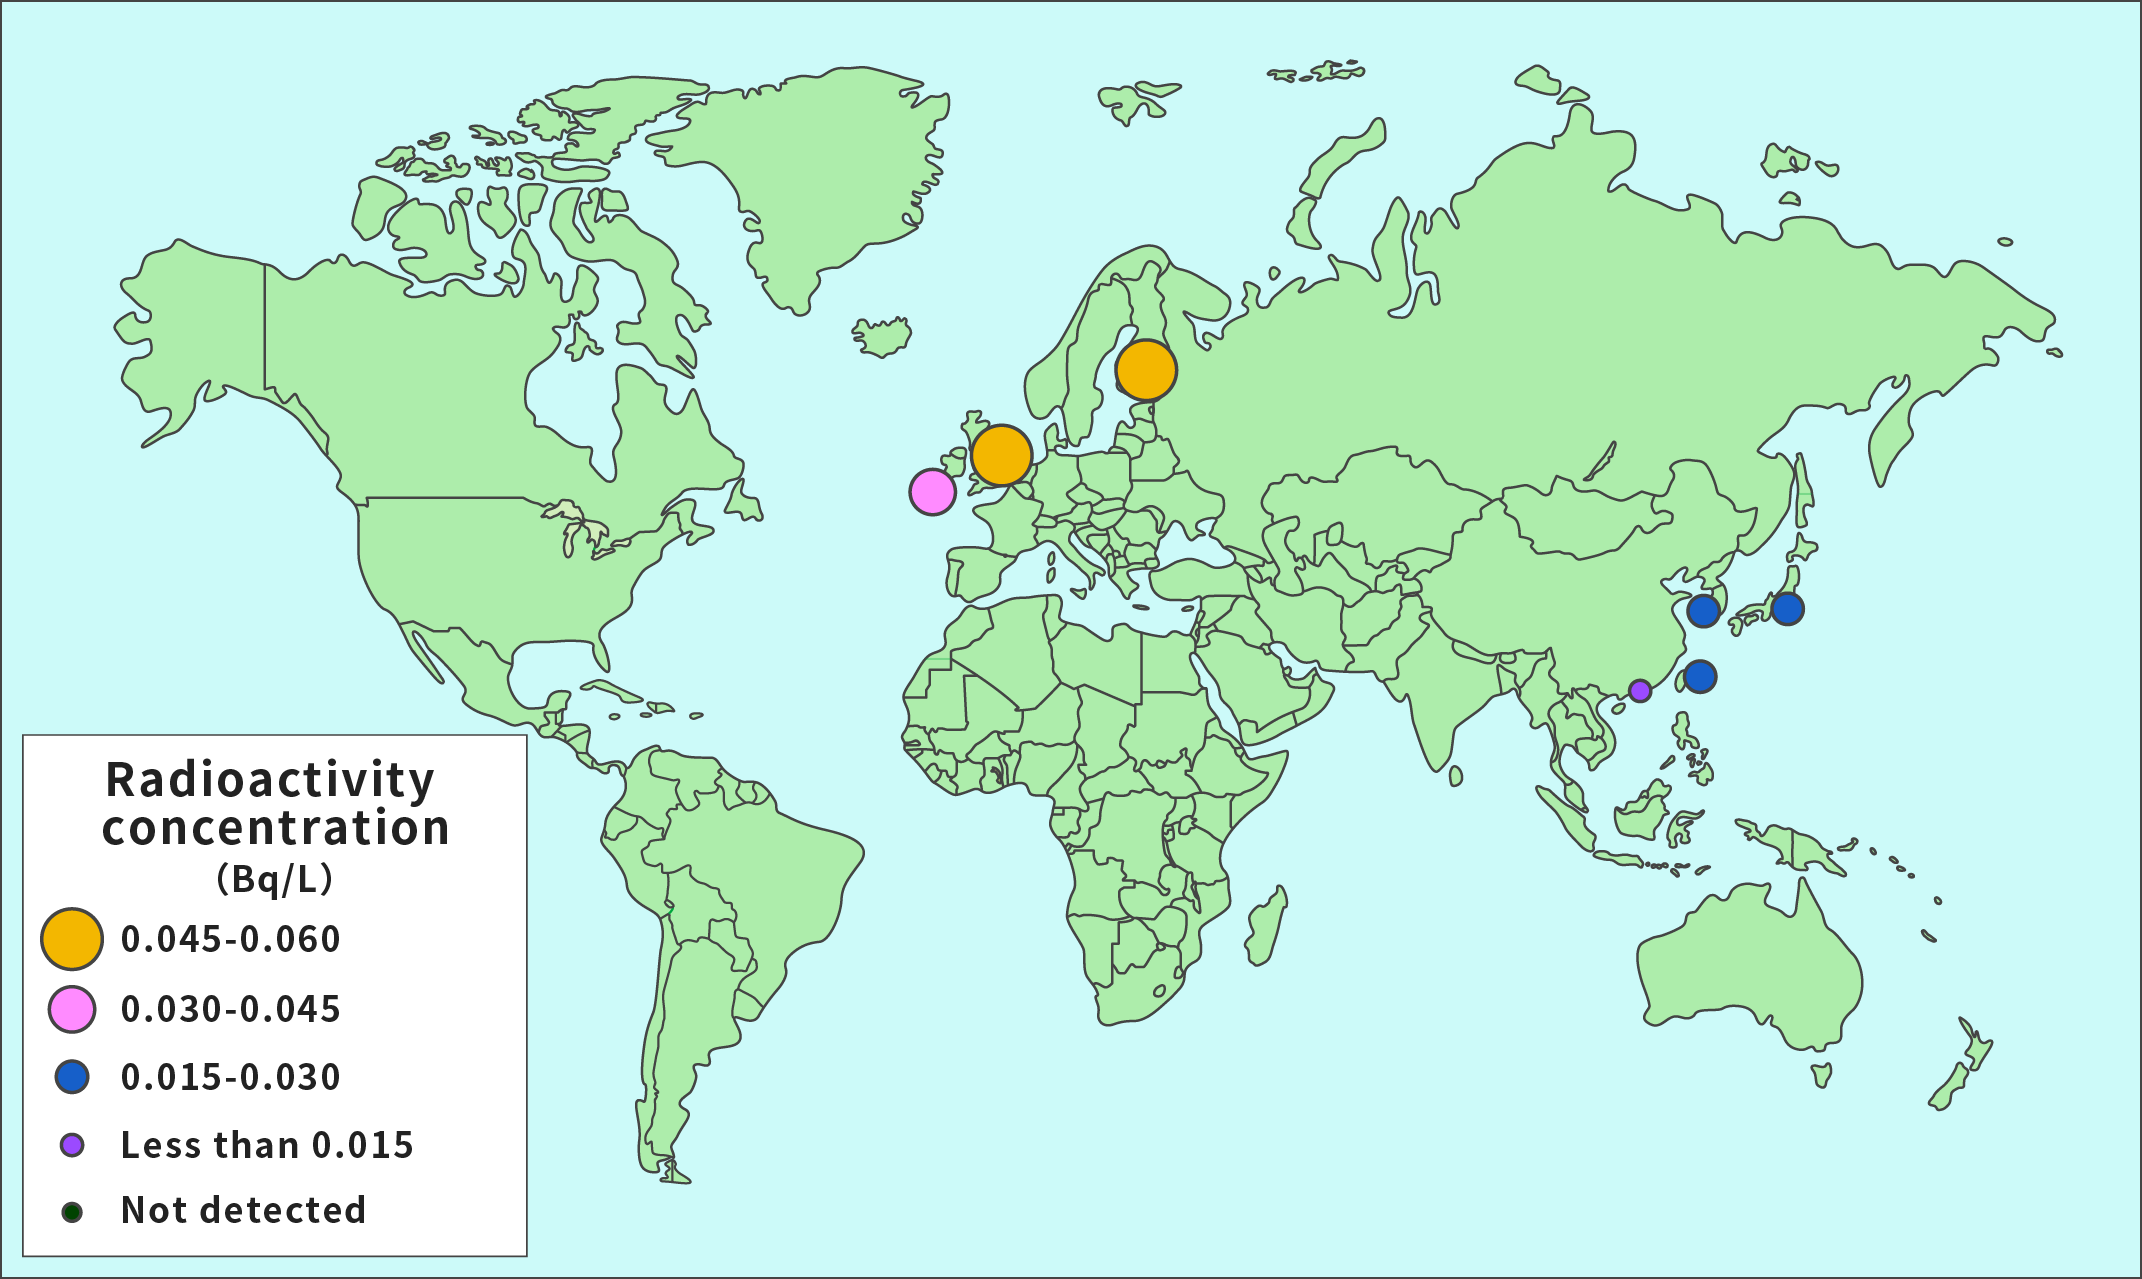
Results of Surveys on Tap Water, Etc., at Various Places in the World (2000)
These maps show the amount of Sr-90 and Cs-137 contained in 1 liter of tap water, etc., at various places in the world in the year 2000.
Data is shown as circles only for the countries and regions for which survey results are available for this survey sample.
Sr-90

Cs-137
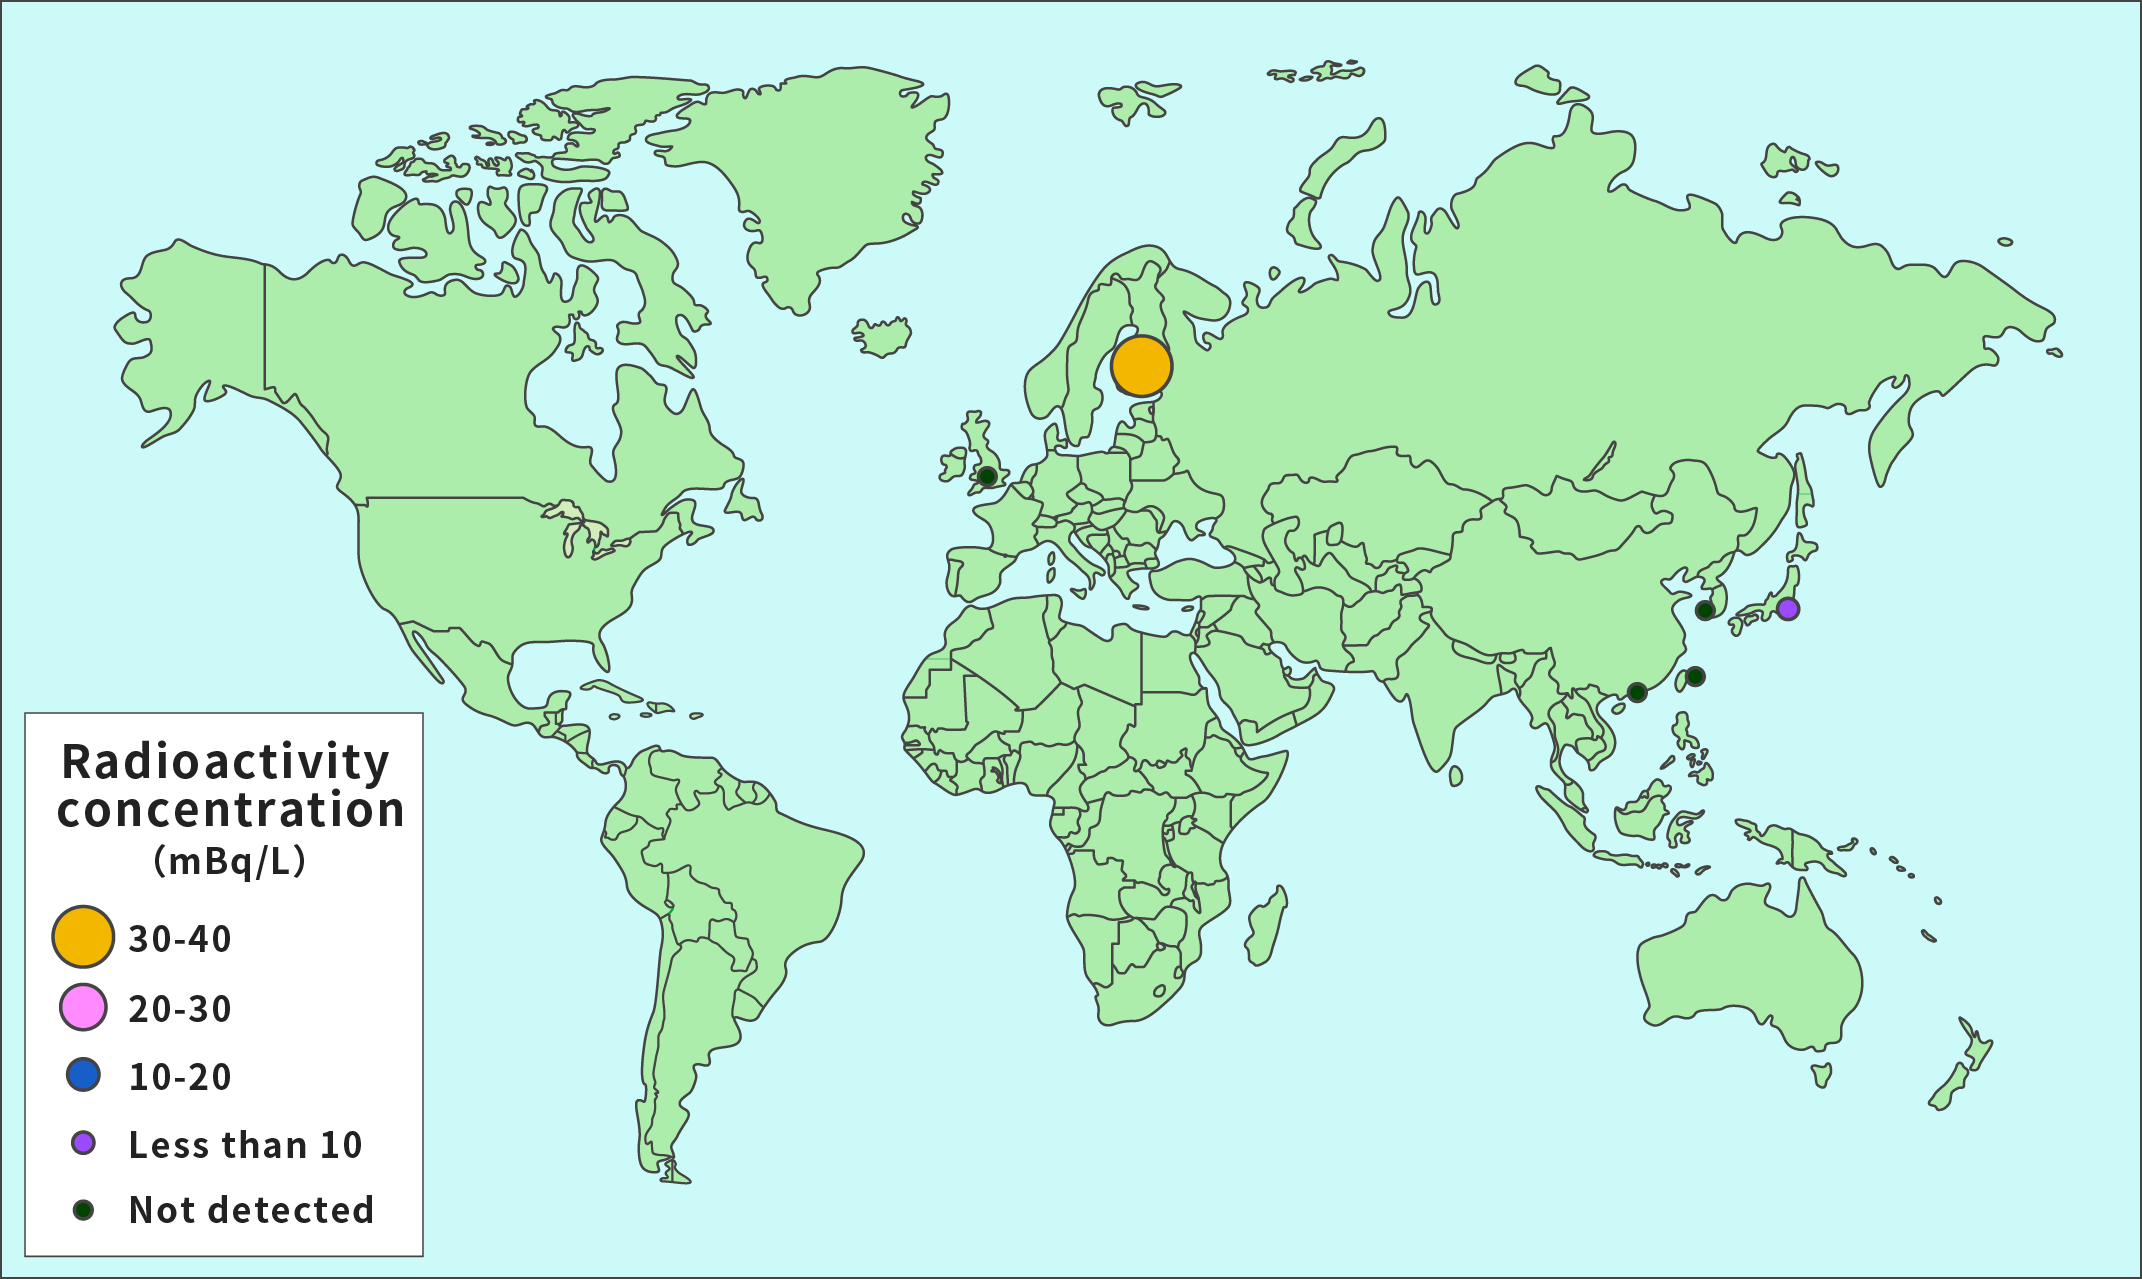
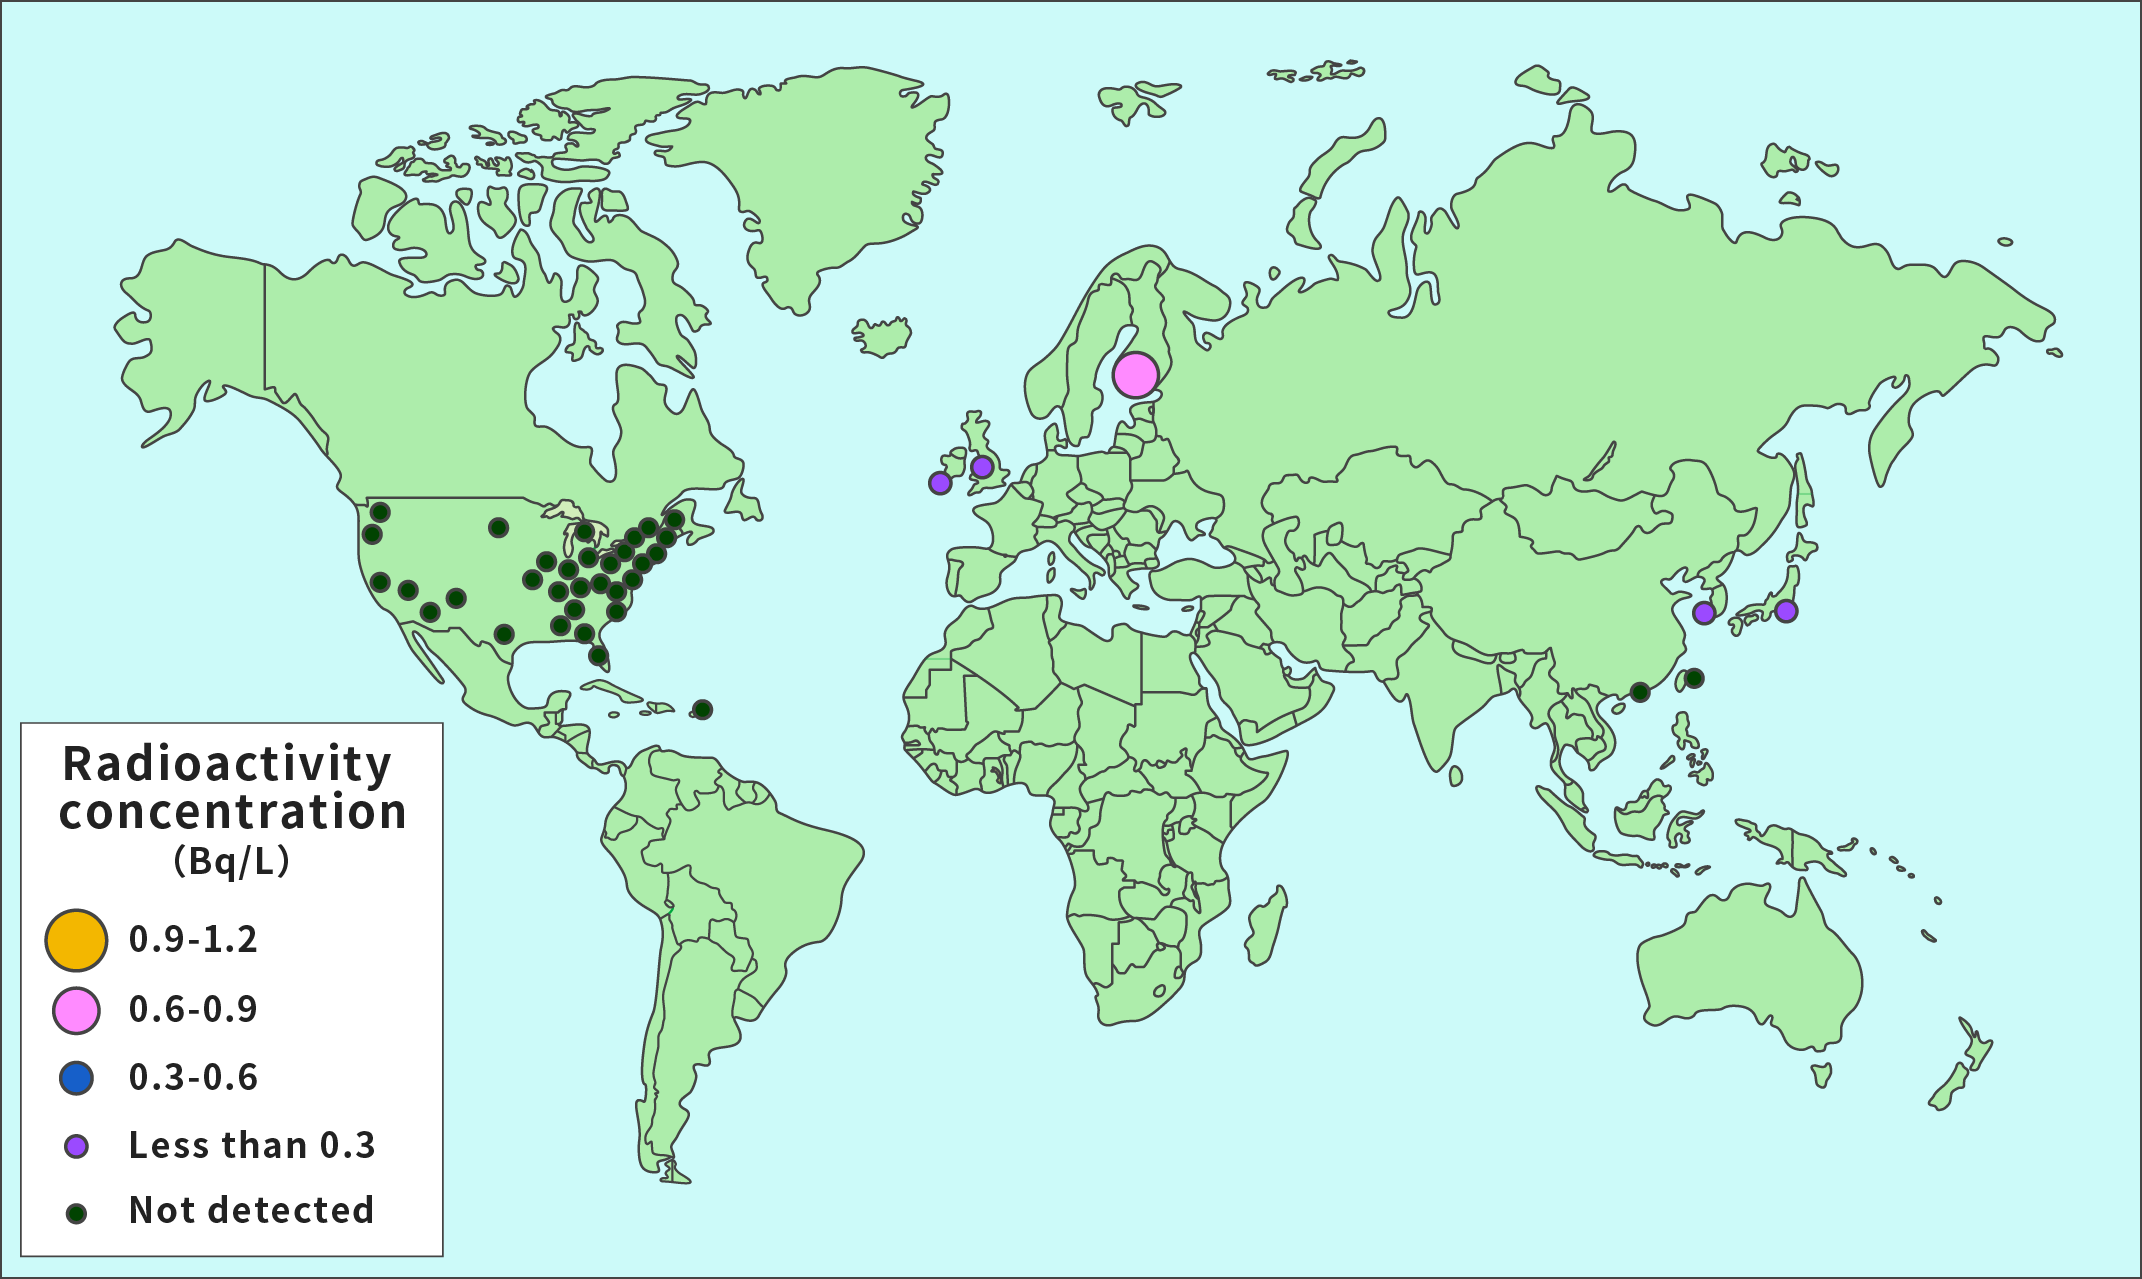
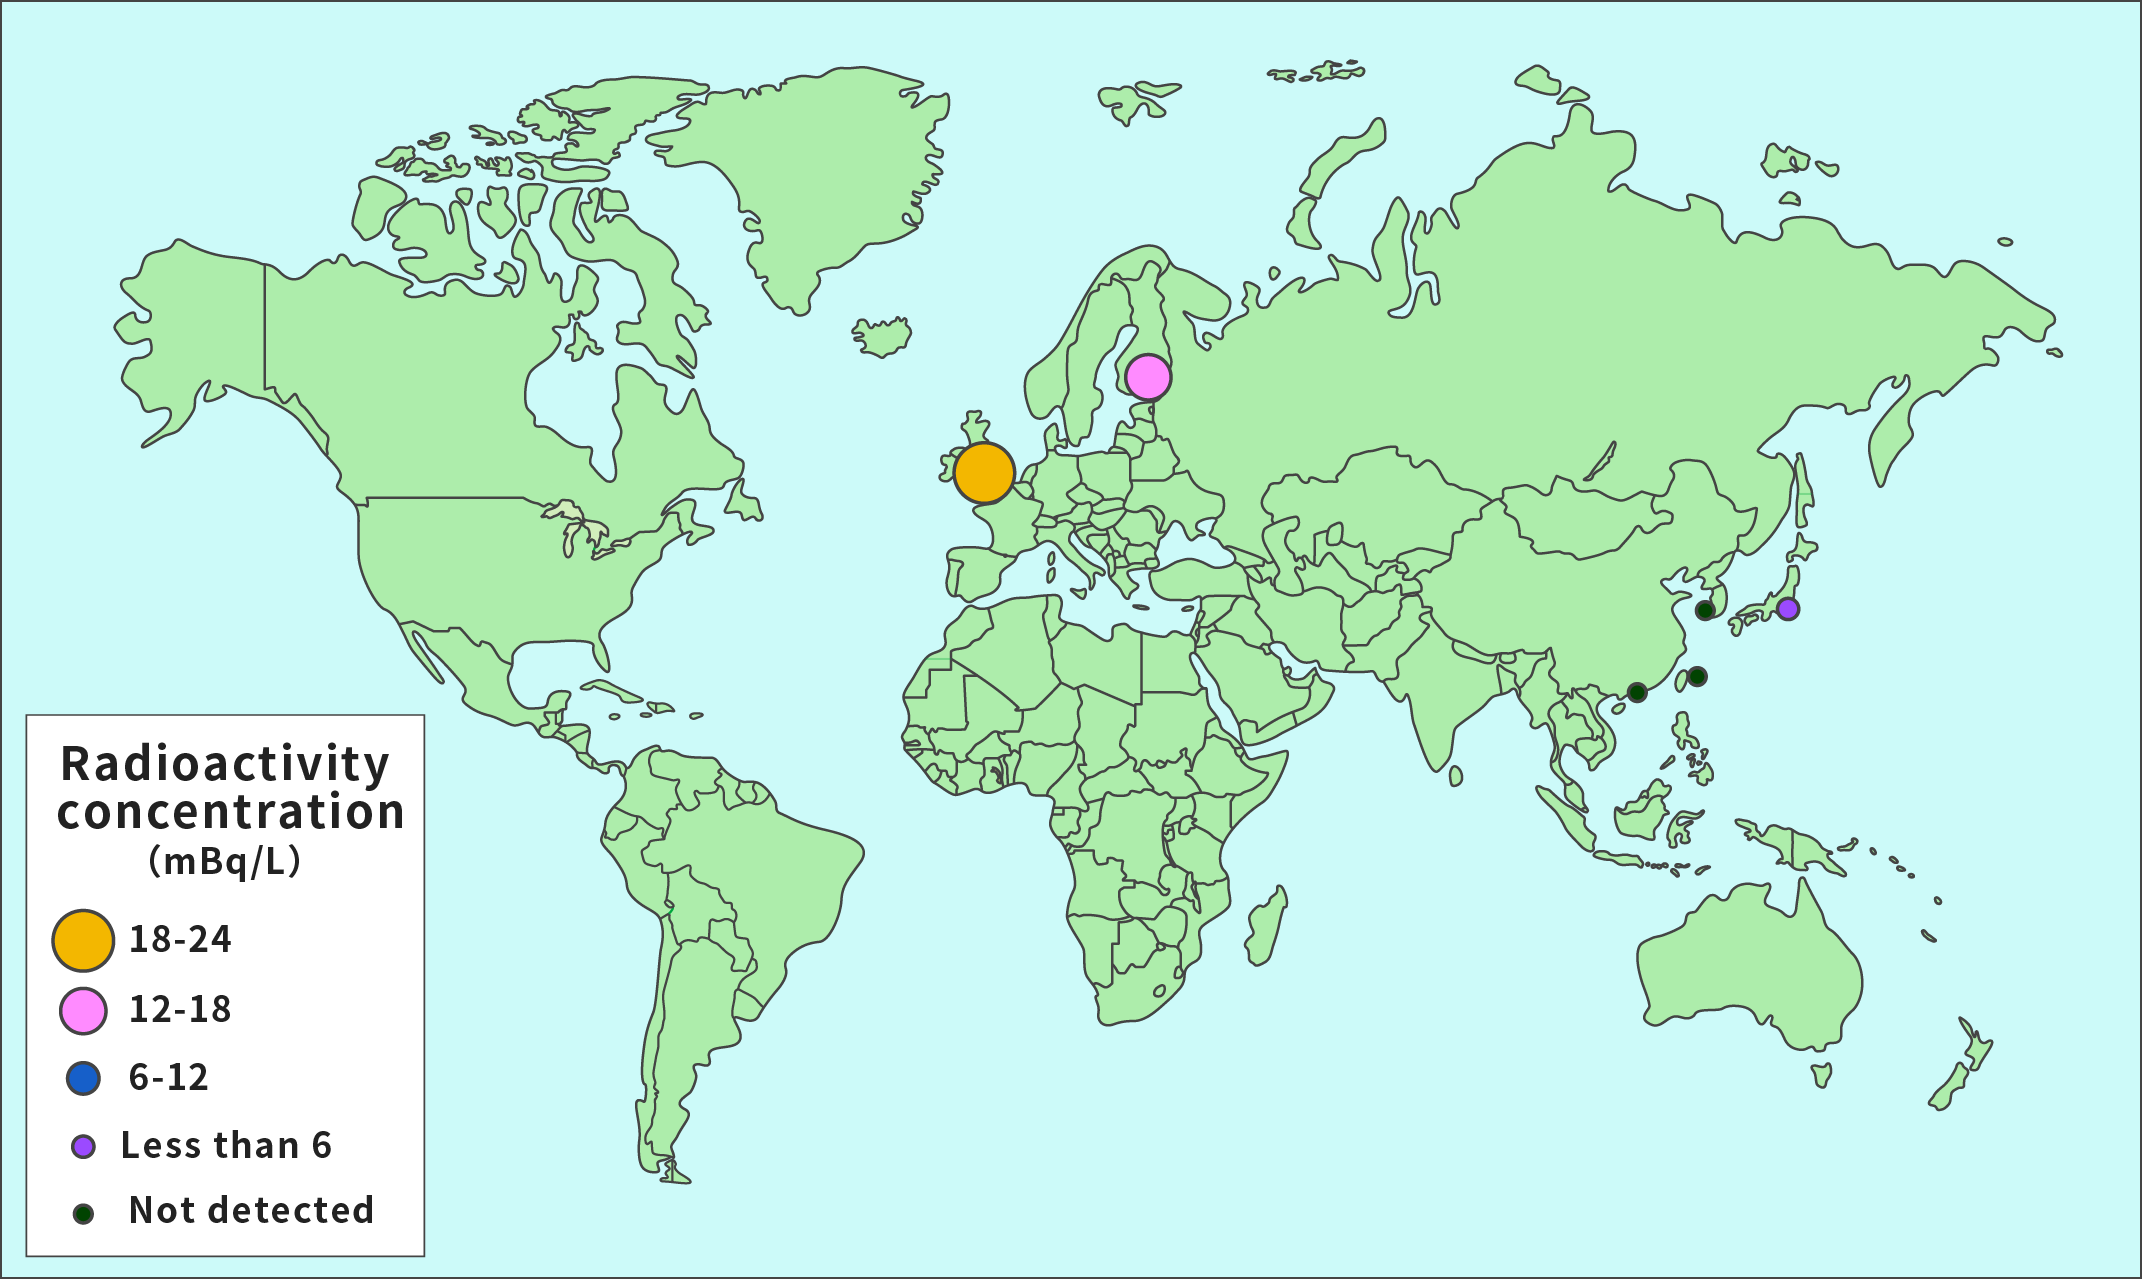
Results of Surveys on River Water, Lake Water, Etc., at Various Places in the World (2000)
These maps show the amount of Sr-90 and Cs-137 contained in 1 liter of river water, lake water, etc., at various places in the world in the year 2000.
Data is shown as circles only for the countries and regions for which survey results are available for this survey sample.
Sr-90

Cs-137
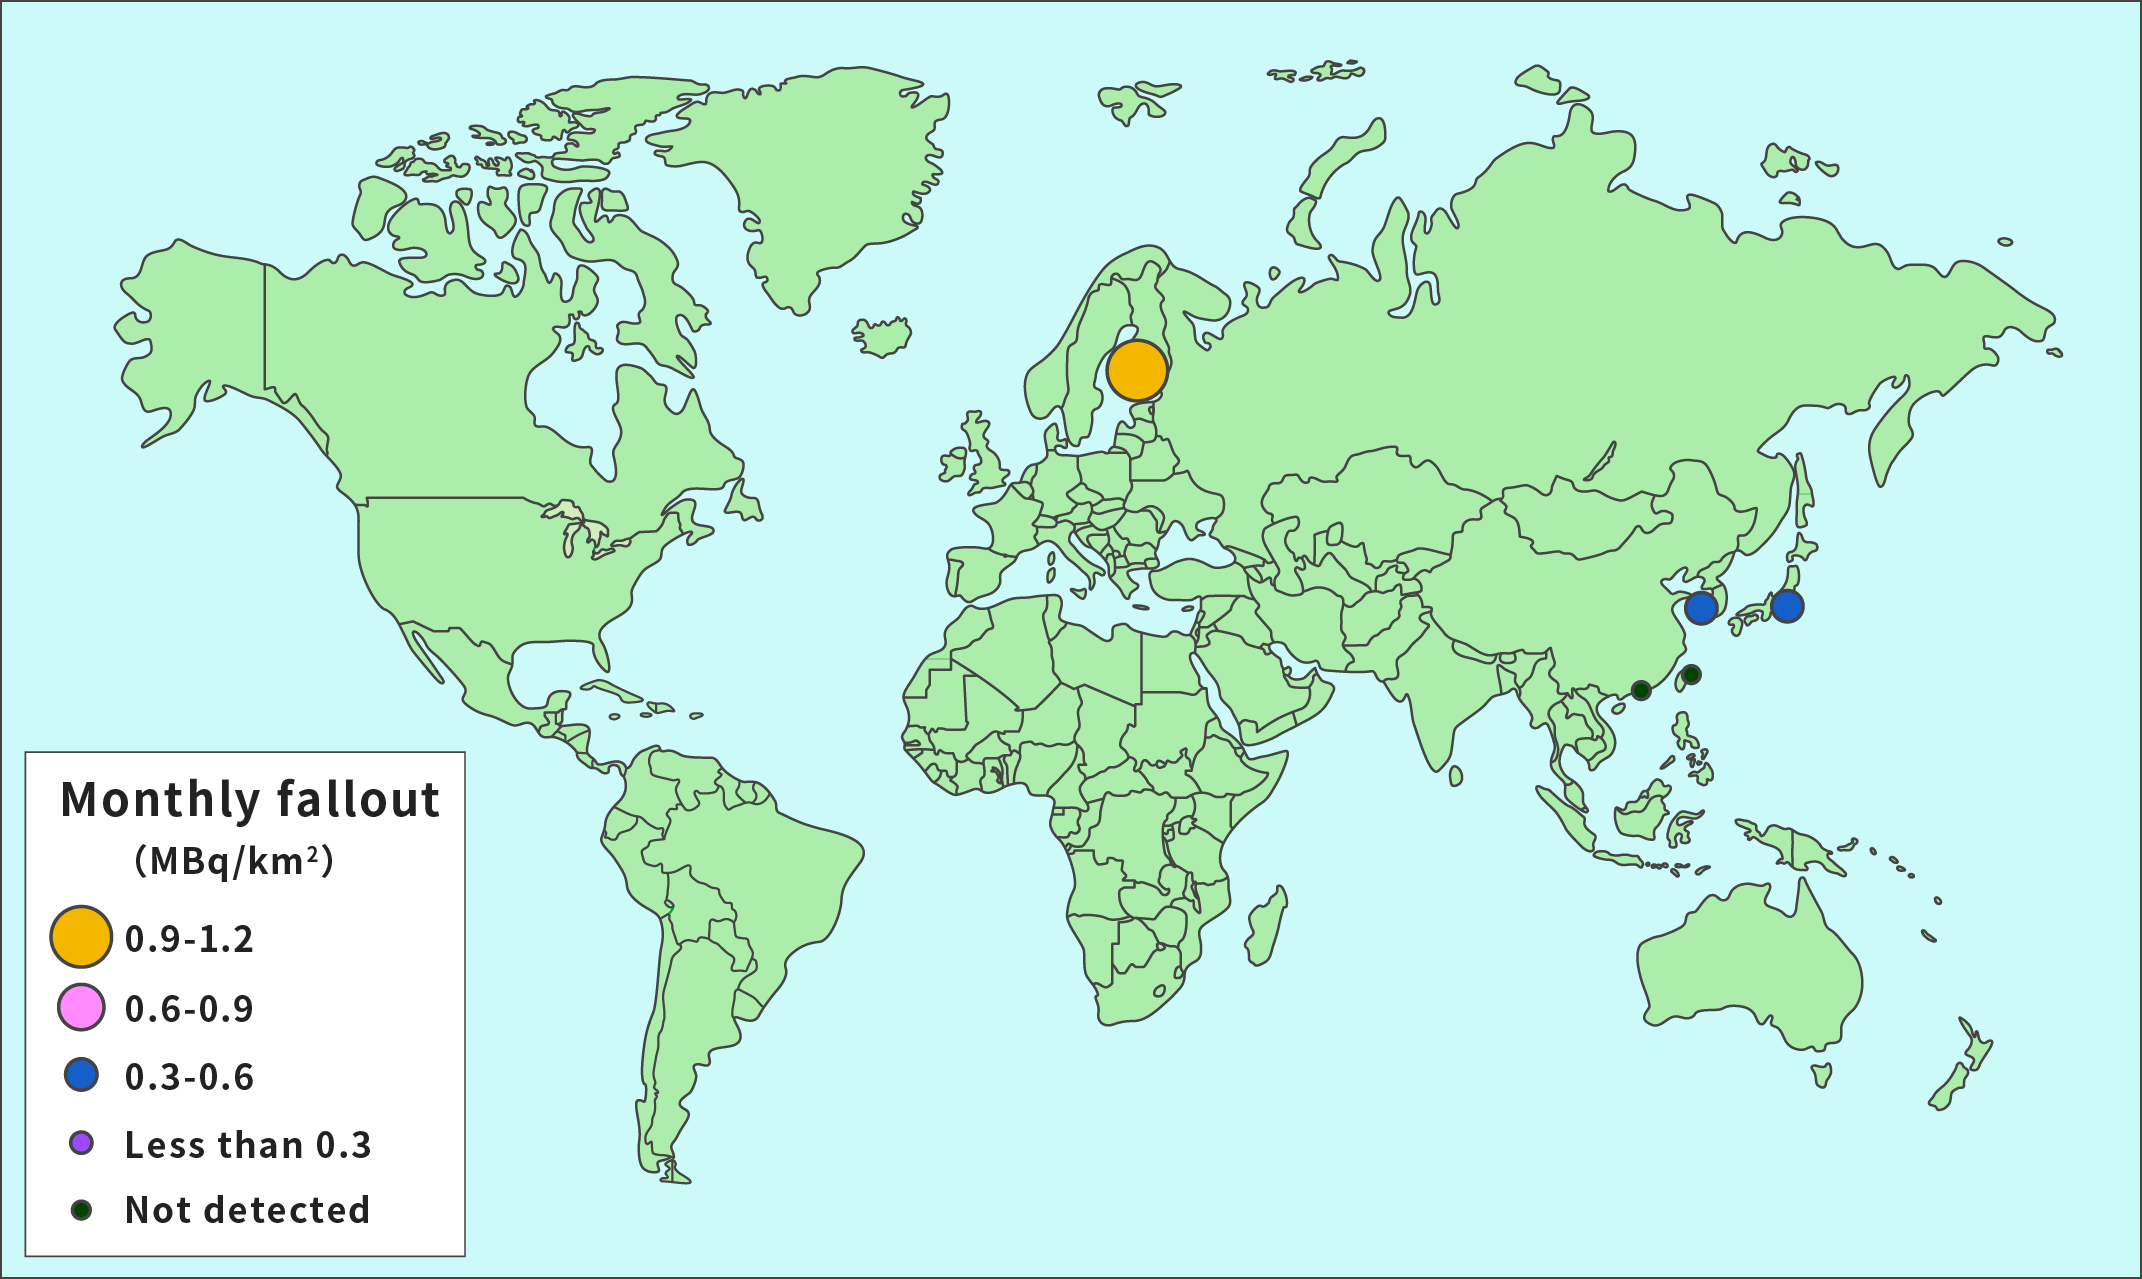
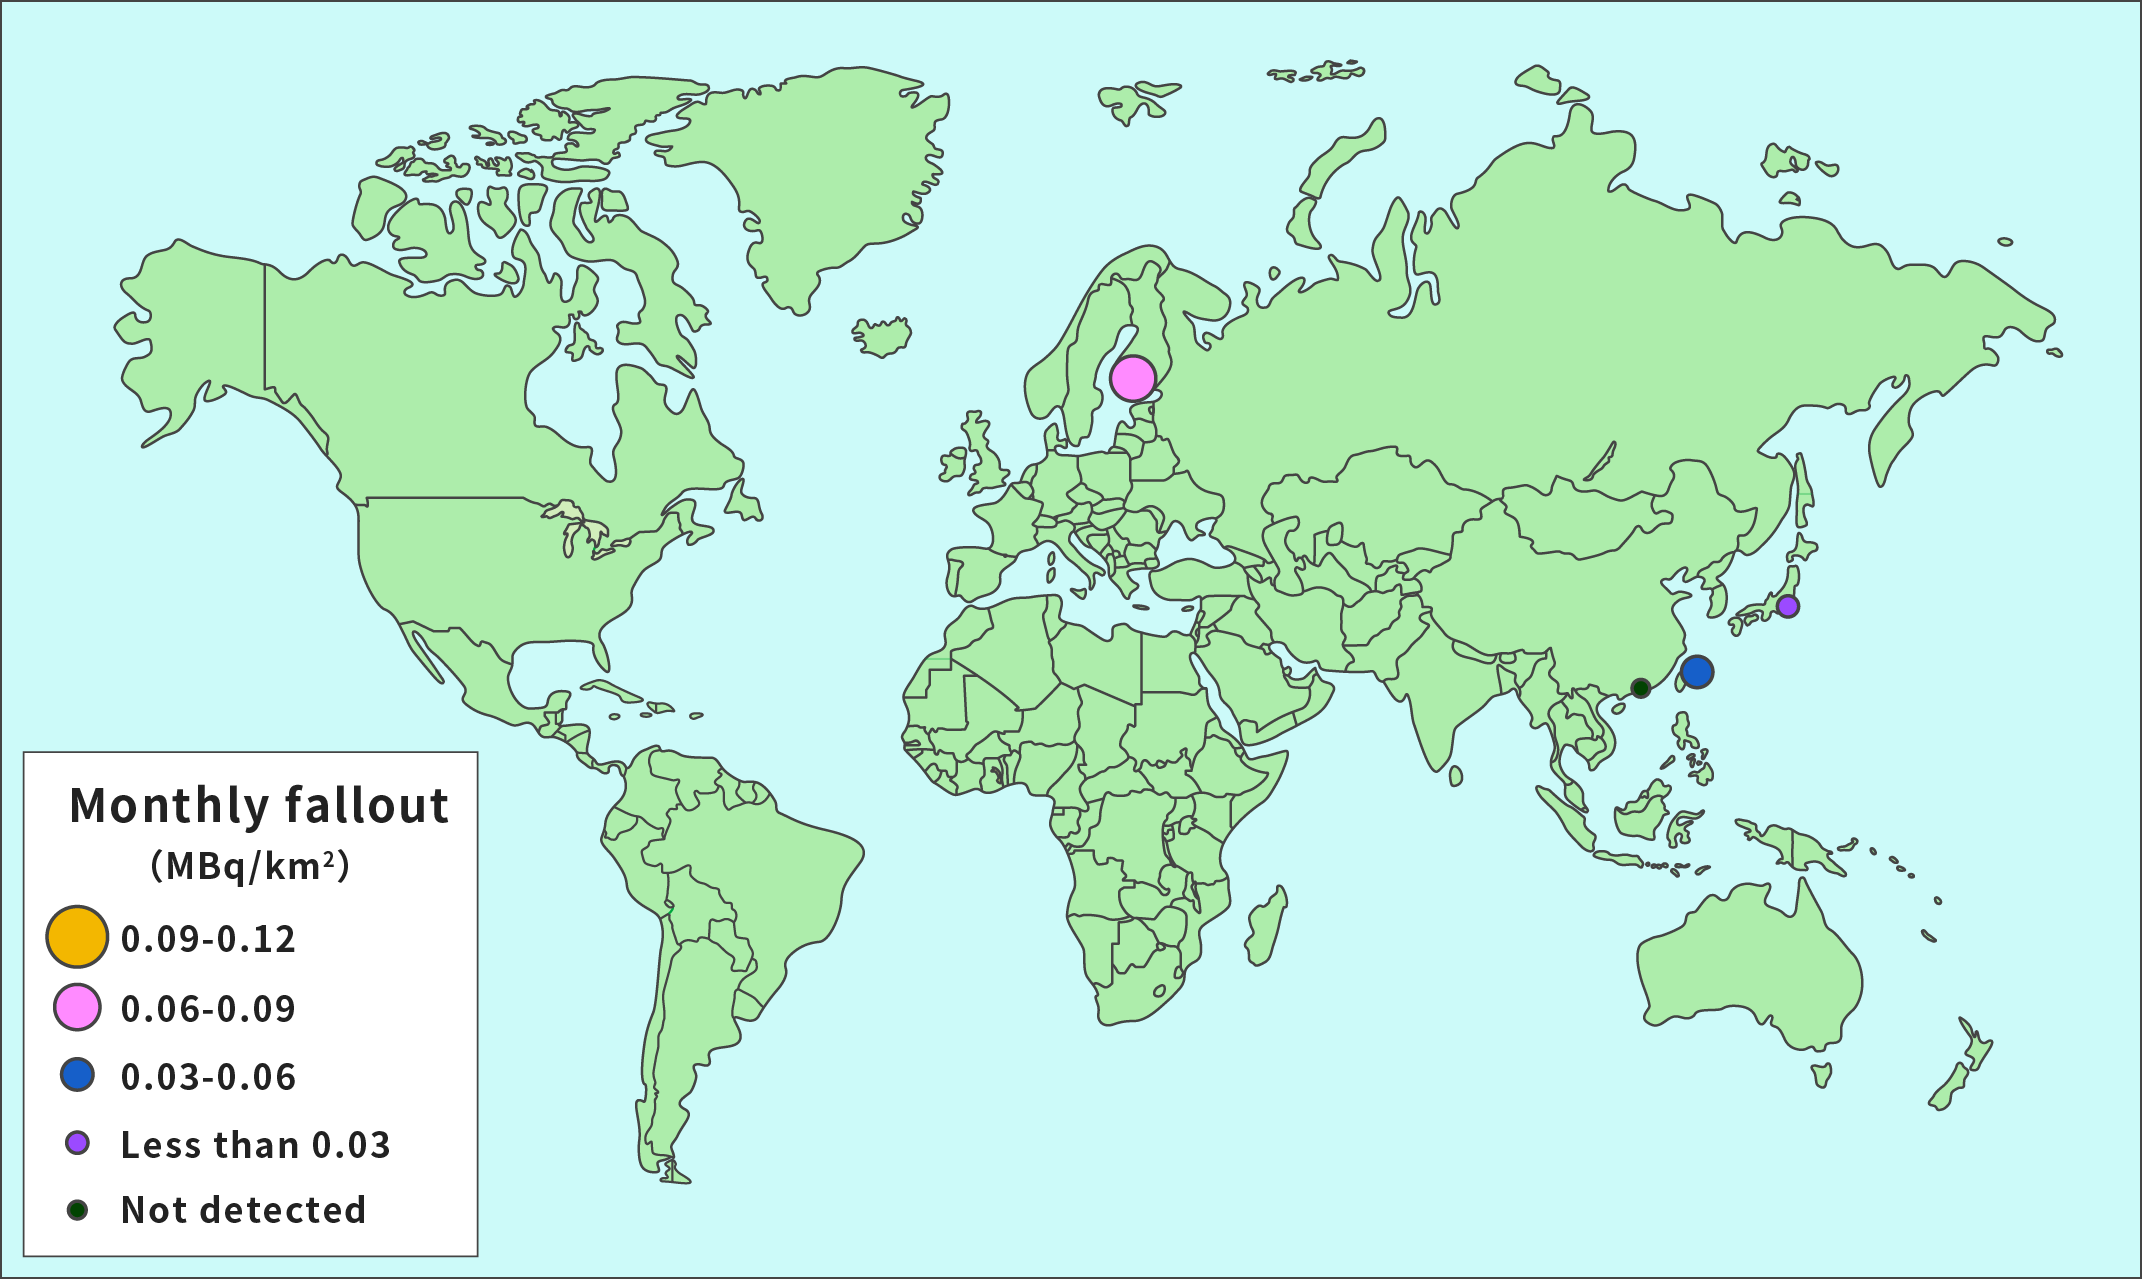
Results of Surveys on Rainwater and Dust (Fallout) at Various Placed in the World (2000)
These maps show the year 2000 average of the amount of Sr-90 and Cs-137 contained in rainwater and dust (fallout) in an area of 1 km2 in a month.
Data is shown as circles only for the countries and regions for which survey results are available for this survey sample.
Sr-90
Cs-137